- Best Ever CRE
- Posts
- 💰 What's really driving the small-market boom?
💰 What's really driving the small-market boom?
Plus: Underwriting tightens, vacancy spikes, institutional capital returns, and much more.
Best Ever CRE Team
January 08, 2026

👋 Hello, Best Ever readers! There are only 357 days left in 2026. Time flies!
In today’s newsletter, small markets win, underwriting tightens, vacancy spikes, institutional capital returns, and much more.
⭐ We're doing something different at Best Ever Conference X this year, and it's specifically for women real estate investors. Get your ticket now to get access to our exclusive Women’s Mastermind with Liz Faircloth.
Let’s CRE!
🗞️ NO-FLUFF NEWS
CRE HEADLINES
⚖️ Tariff Verdict: Supreme Court could rule Friday on Trump's IEEPA tariffs after lower courts struck them down, with betting markets showing just a 23-31% chance Trump wins and critical questions remaining over potential refunds.
💰 Lending Squeeze: 2026 underwriting standards have tightened sharply as lenders demand strong cash flow, experienced sponsorship, and fresh equity injections for refinancings, with marginal assets facing stricter DSCR tests and possible loan-to-own scenarios.
🏘️ Migration Shift: Americans are moving to smaller markets like Oregon, the Carolinas, and Arkansas for affordability, pushing investors toward workforce housing, modest office parks, and discount retail over high-end development.
🤖 AI Impact: Vanguard finds that 100 occupations most exposed to AI automation have outperformed the broader labor market in job growth and wages, suggesting AI is augmenting productivity rather than eliminating white-collar office demand.
🏪 Lease Leverage: Retailers are getting more creative with leases, converting them into strategic flexibility tools through Chapter 11 restructurings, shorter terms with kick-out clauses, and percentage-based rent structures offering downside protection with landlord upside potential.
🏆 TOP STORY
WHAT’S REALLY DRIVING THE SMALL-MARKET BOOM?
For decades, the site selection playbook was simple: follow the population. If you wanted talent, capital, and growth, you bet on big metros with big headcounts. But that script has flipped.
Across 949 ranked U.S. metros on Area Development Magazine’s annual list of top metro locations, smaller and mid-sized metros are dramatically outperforming major cities, while large metros show far less variability in competitiveness. The highest performers share common characteristics: workforce agility over workforce size, housing affordability over amenity density, and infrastructure adaptation over legacy systems.
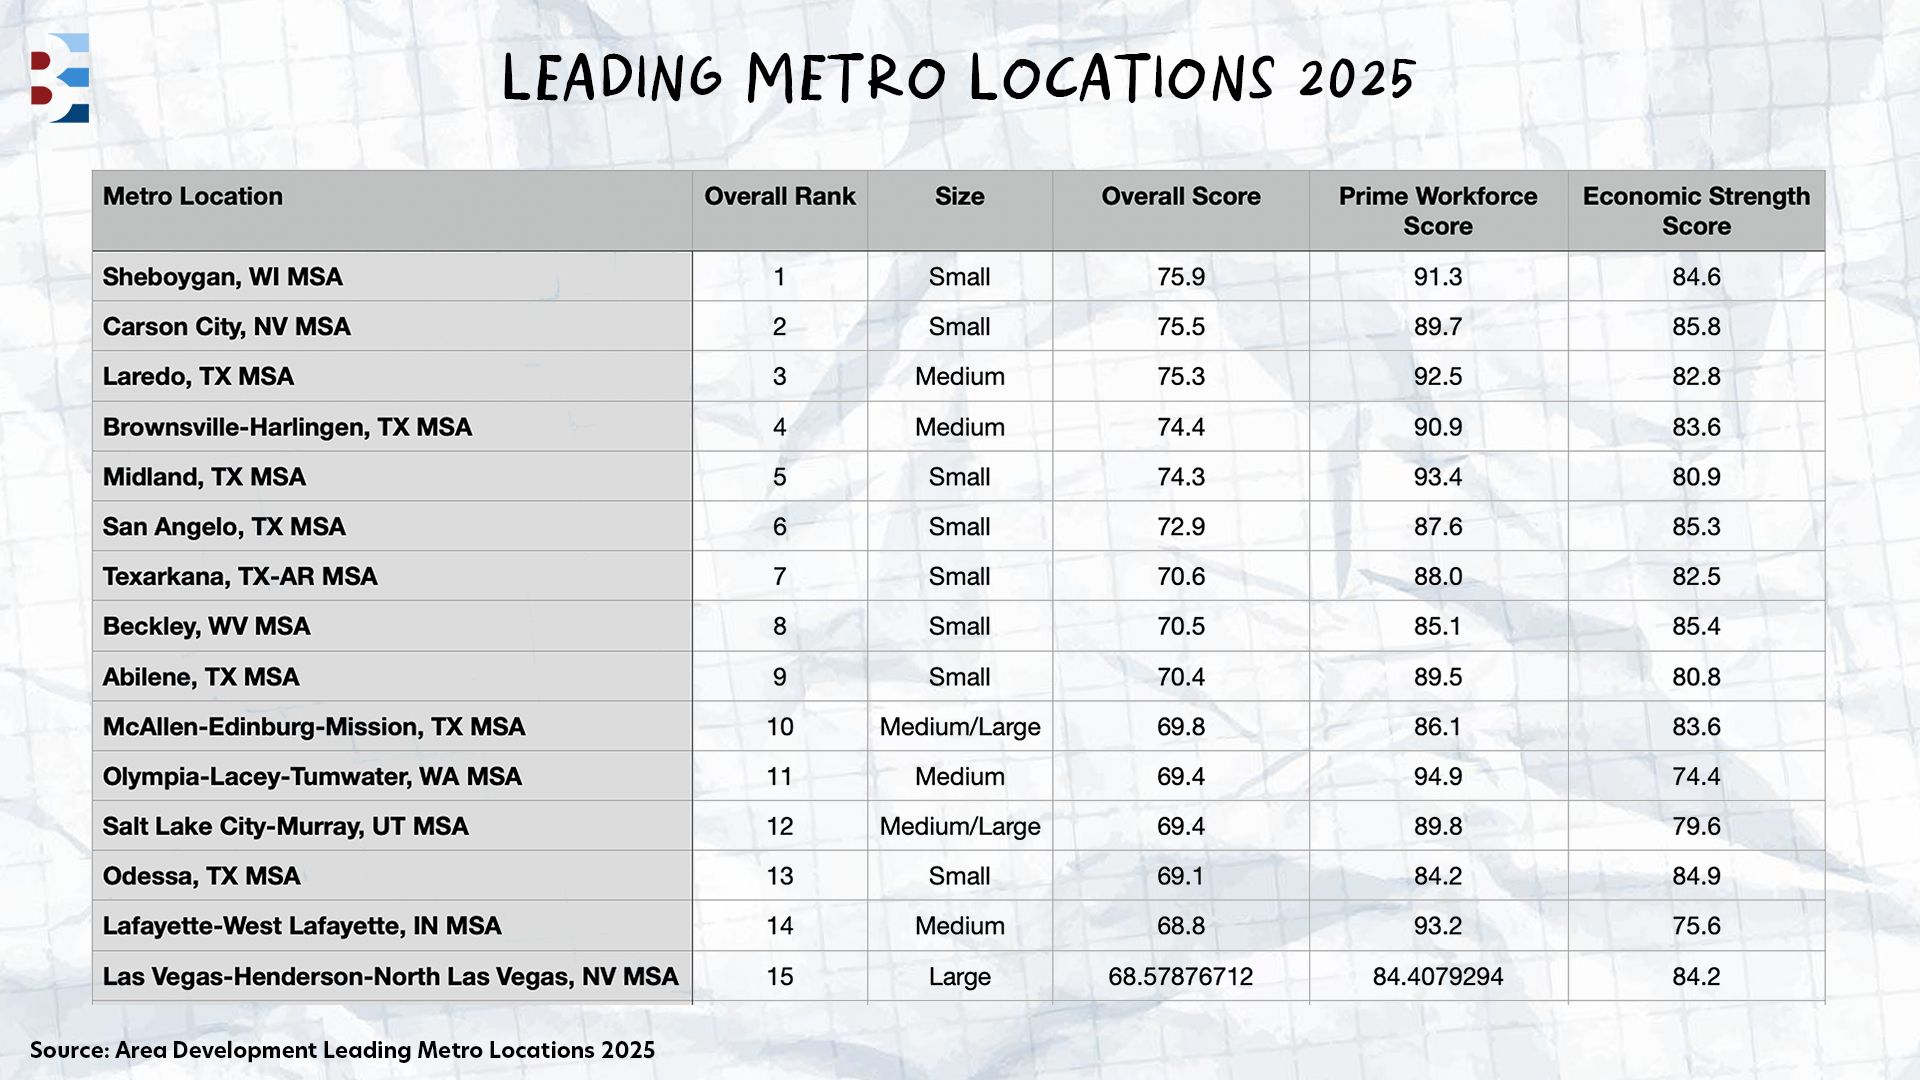
Here are the top 15 metro locations for 2025:
Sheboygan, WI (Small)
Carson City, NV (Small)
Laredo, TX (Medium)
Brownsville-Harlingen, TX (Medium)
Midland, TX (Small)
San Angelo, TX (Small)
Texarkana, TX-AR (Small)
Beckley, WV (Small)
Abilene, TX (Small)
McAllen-Edinburg-Mission, TX (Medium/Large)
Olympia-Lacey-Tumwater, WA (Medium)
Salt Lake City-Murray, UT (Medium/Large)
Odessa, TX (Small)
Lafayette-West Lafayette, IN (Medium)
Las Vegas-Henderson-North Las Vegas, NV (Large)
🏅 Texas dominates the overall rankings with 68 regions represented across all categories, followed by Utah, Georgia, and Indiana — states that have invested heavily in workforce systems and logistics infrastructure. The Mountain West and Southwest divisions lead the nation, scoring roughly ten points above the national median in total competitiveness.
📈 Medium markets like Laredo, Brownsville-Harlingen, and McAllen are thriving as critical nodes in North American supply chains, capitalizing on nearshoring trends and trade corridors. Salt Lake City-Murray and smaller markets like Carson City are attracting tech and clean-energy investments through affordability and workforce participation.
💼 When measuring workforce quality specifically, the Prime Workforce rankings reveal a separate set of leaders: Laramie, WY; Vernal, UT; and Helena, MT posted near-perfect scores thanks to high STEM employment concentrations, wage growth, and strong prime-age worker participation. The best labor pools aren't always the biggest ones.
THE BOTTOM LINE
Looking ahead to 2026, housing affordability paired with job growth has emerged as the strongest predictor of competitiveness. Regions demonstrating infrastructure resilience — particularly multimodal freight corridors, broadband quality, and power grid reliability — will rise, while those with aging systems will struggle to keep pace. And with 13 of the top 15 metros being small or mid-sized, the next decade of CRE growth will likely happen in markets most investors aren't watching yet.
👉 For more granular, regional data, view the complete rankings here.
🎉 BEST EVER CONFERENCE
FOR WOMEN BUILDING REAL ESTATE BUSINESSES

⭐ For the first time at Best Ever Conference, we're hosting an exclusive workshop specifically for women real estate investors.
Liz Faircloth, co-founder of InvestHER and a seasoned investor with over 20 years of experience and $160M under management, is leading a high-level mastermind for women actively building real estate businesses. Bring the decisions you've been carrying and the strategic challenges you're navigating right now. You'll work through them in real-time with Liz and other experienced women investors in the room.
What You'll Get:
Clarity on your next move – Walk away knowing exactly what decision to make and how to move forward with confidence
Strategic guidance from someone who's been there – Learn from Liz's 20+ years of experience building a $160M portfolio
A room full of women who get it – Connect with other women actively scaling their real estate businesses and facing similar challenges
Actionable direction, not just inspiration – This is a working session focused on helping you make real decisions about your business
Space is intentionally limited to keep the conversation meaningful and actionable, so get your ticket to BEC X today to reserve your spot.
💰 CRE BY THE NUMBERS
MULTIFAMILY VACANCY, D.C. CONVERSIONS, AND MORE
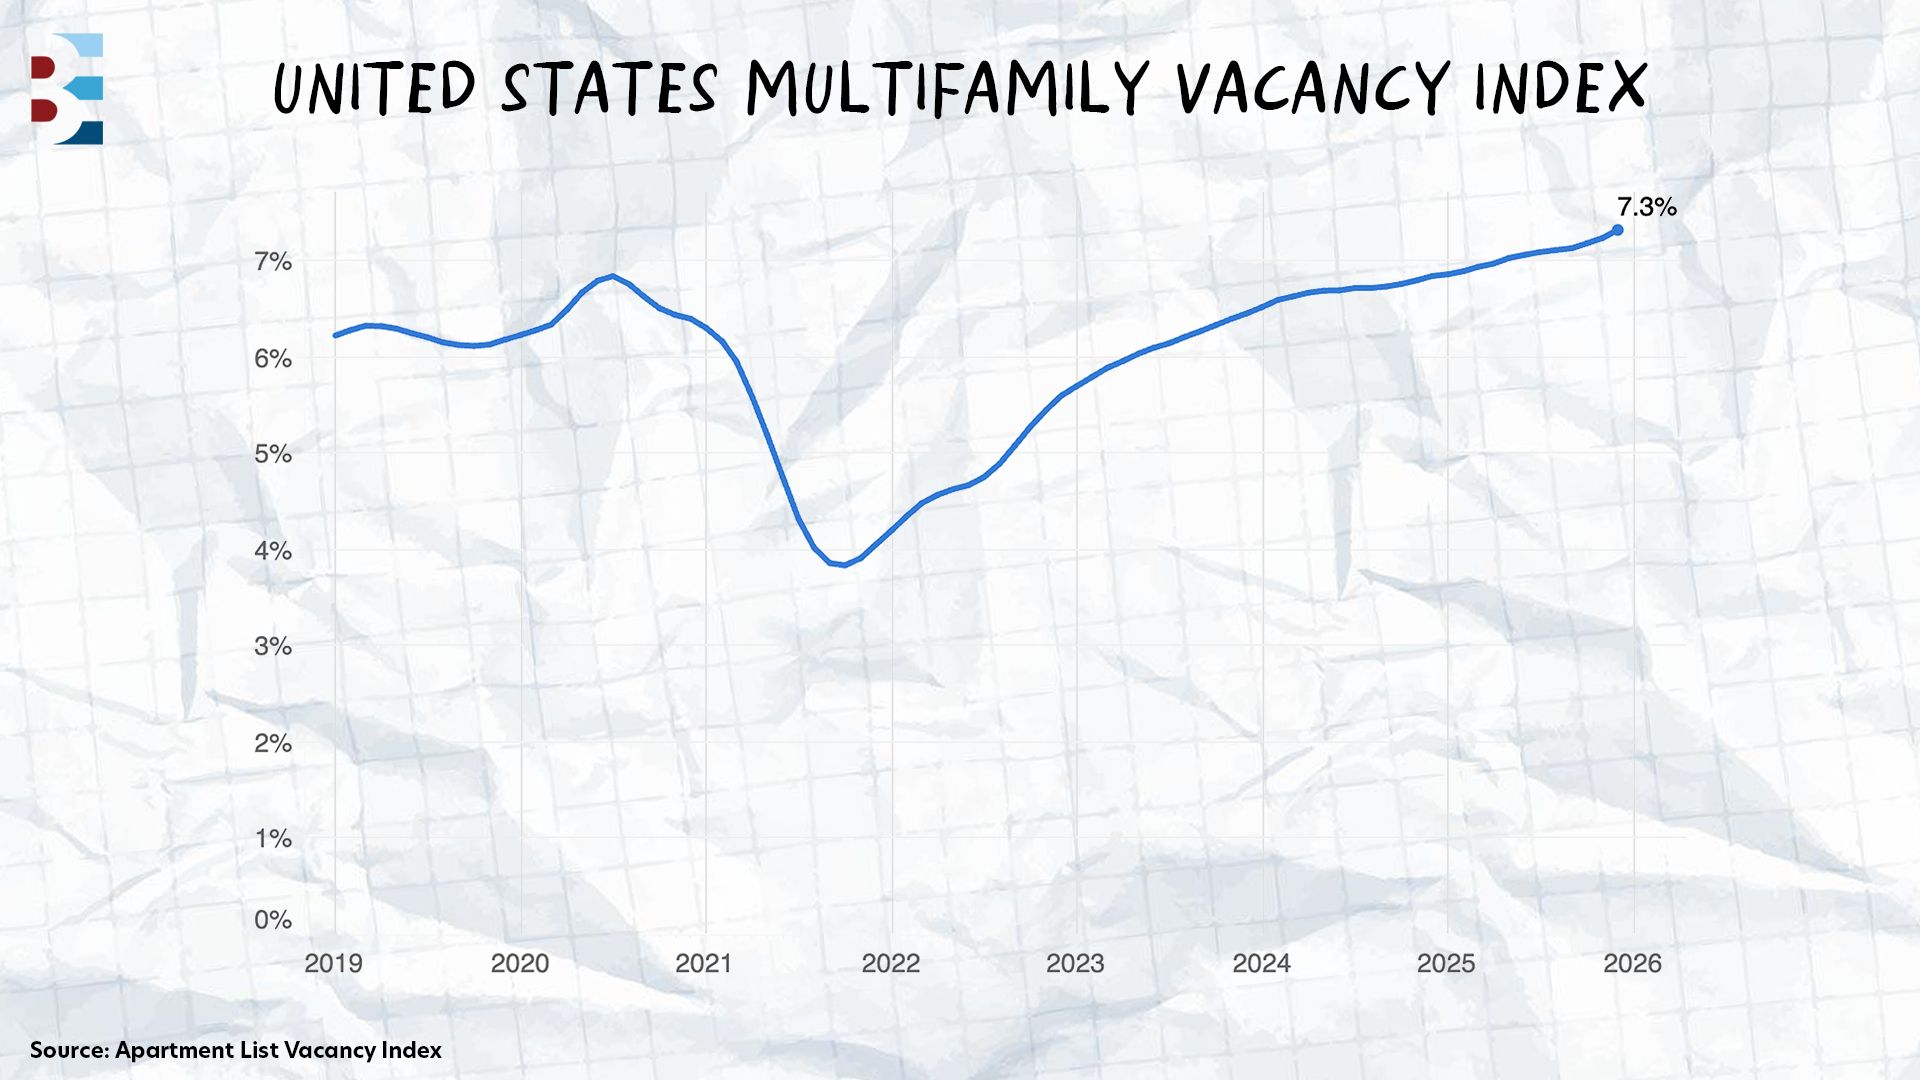
🏢 7.3%
National multifamily vacancy hit a record 7.3% in December as the market continues absorbing supply from 600,000 units delivered in 2024, the most since 1986. Units now take 39 days to lease after listing — three days longer than last year and another record high dating back to 2019.
🏭 $8.76 PSF
National industrial rents grew 5.7% YoY to average $8.76 PSF despite vacancy rates surging to 9.7% as supply flooded the market. Atlanta led rent growth at 9.7% and Miami posted 8.6%, while lease spreads narrowed to $1.31 PSF from $2.14 PSF a year earlier.
🏘️ 6,500 Units
Washington D.C. has over 6,500 residential units in the office-to-residential conversion pipeline, second only to New York City, driven by the district's 22.8% office vacancy rate and generous government incentives. Nationwide, more than 70,000 conversion units are in the pipeline — triple the number from 2022.
📊 6.81%
Net lease cap rates rose just one basis point in Q4 to 6.81%, continuing three quarters of stability even after the Fed's December rate cut. Investors have shifted focus from monetary policy to property-specific fundamentals like lease duration, tenant credit, and sector resilience as bid-ask spreads narrow.
🎙️ THE BEST EVER CRE SHOW
WHY INSTITUTIONAL CAPITAL COULD (FINALLY) BE BACK

For the past year, we have seen — and in this newsletter, have written — headlines proclaiming that institutional capital is about to flood back into CRE. But it’s been more of a drip. That could finally change in 2026. According to John Chang, the pressure to rebalance portfolios is mounting as pension funds, insurance companies, and sovereign wealth are all under-allocated to real estate and NAICREIF returns have flipped positive.
This week on the Best Ever CRE Show, John broke down the institutional capital wave, explaining why these buyers could finally be ready to act, and what it means for deal flow, cap rates, and competition for larger assets.
The Allocation Gap: Public pensions currently allocate 10.1% of portfolios to CRE against an 11.3% target, while private pensions sit at 12.2% versus a 12.6% target. Insurance companies and sovereign wealth funds show similar gaps, creating systemic buying pressure as these institutions rebalance toward target allocations in 2026.
Capital Needs a Home: Dry powder sits at $220 billion. That's down from $400 billion in 2022, but institutions are raising capital again and need to put existing reserves to work. NAICREIF Total Returns have pushed back into positive territory across all property types, giving institutions the confidence to deploy after two years of negative returns.
Follow the Allocation: Institutions allocate 41% of CRE portfolios to multifamily and 30% to industrial, with most targeting assets above $20 million. They're still favoring Sun Belt markets like Texas, Florida, Phoenix, Atlanta, and Charlotte over Midwest and Northeast metros, potentially creating opportunities for private investors in slower-growth markets with less institutional competition.
More institutional activity will bring liquidity and velocity back to the market, which is what investors have been waiting for. But John warns that more competition doesn't always mean higher valuations, especially when institutions are filling allocation gaps, not chasing yield compression. "If you're an investor thinking, 'I'm going to wait for prices to get better,'" John says, "you may be holding for a long time."
🙏 Thanks for reading!
Stay in the loop with us! If you received this newsletter from someone else, subscribe here. You can also find us on LinkedIn, Instagram, and YouTube.
Have a Best Ever day!
— Joe Fairless